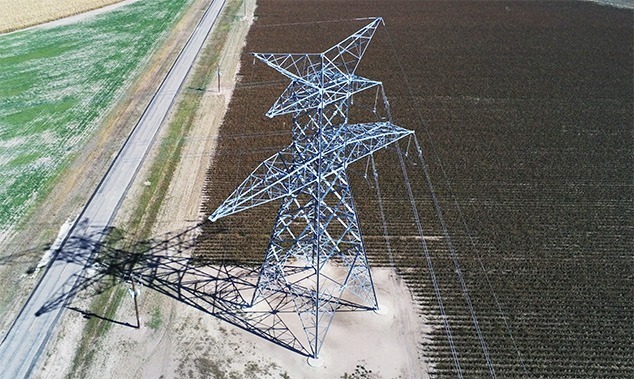
In early 2019 SAM completed a project for an electric utility company to inspect, map with LiDAR, and model its entire transmission system in six distinct geographic areas across the state of Texas. There were several goals for the project:
- First was to inspect 6,927 electric transmission structures, using visual and thermal imagery to identify potential defects.
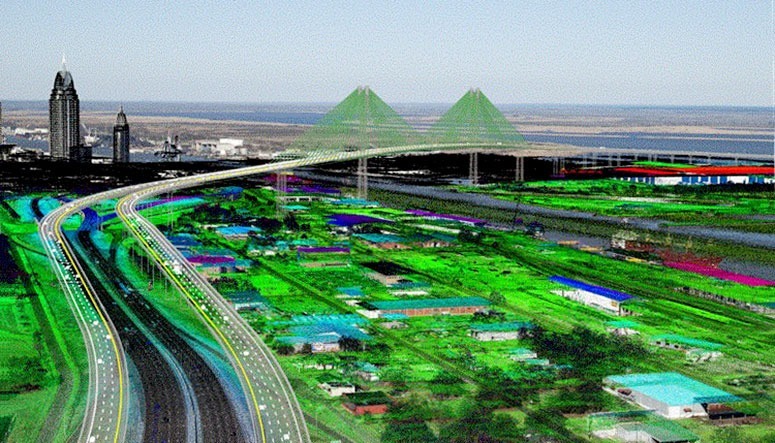
- Second was to map, using LiDAR and Nadir Imagery, 1,105 miles of the right of way (ROW). Coincidental to this task was scanning for and identifying vegetation and other encroachments in the ROW.
- Third was to identify, inspect, and geo-locate all access gates. At the time of the project the utility possessed no maps or digital files showing the location of the gates.
- Fourth, as SAM personnel passed along the ROW itself, they were to geo-locate and identify any ROW impediments that would keep the utility’s personnel from freely moving up and down the ROW.
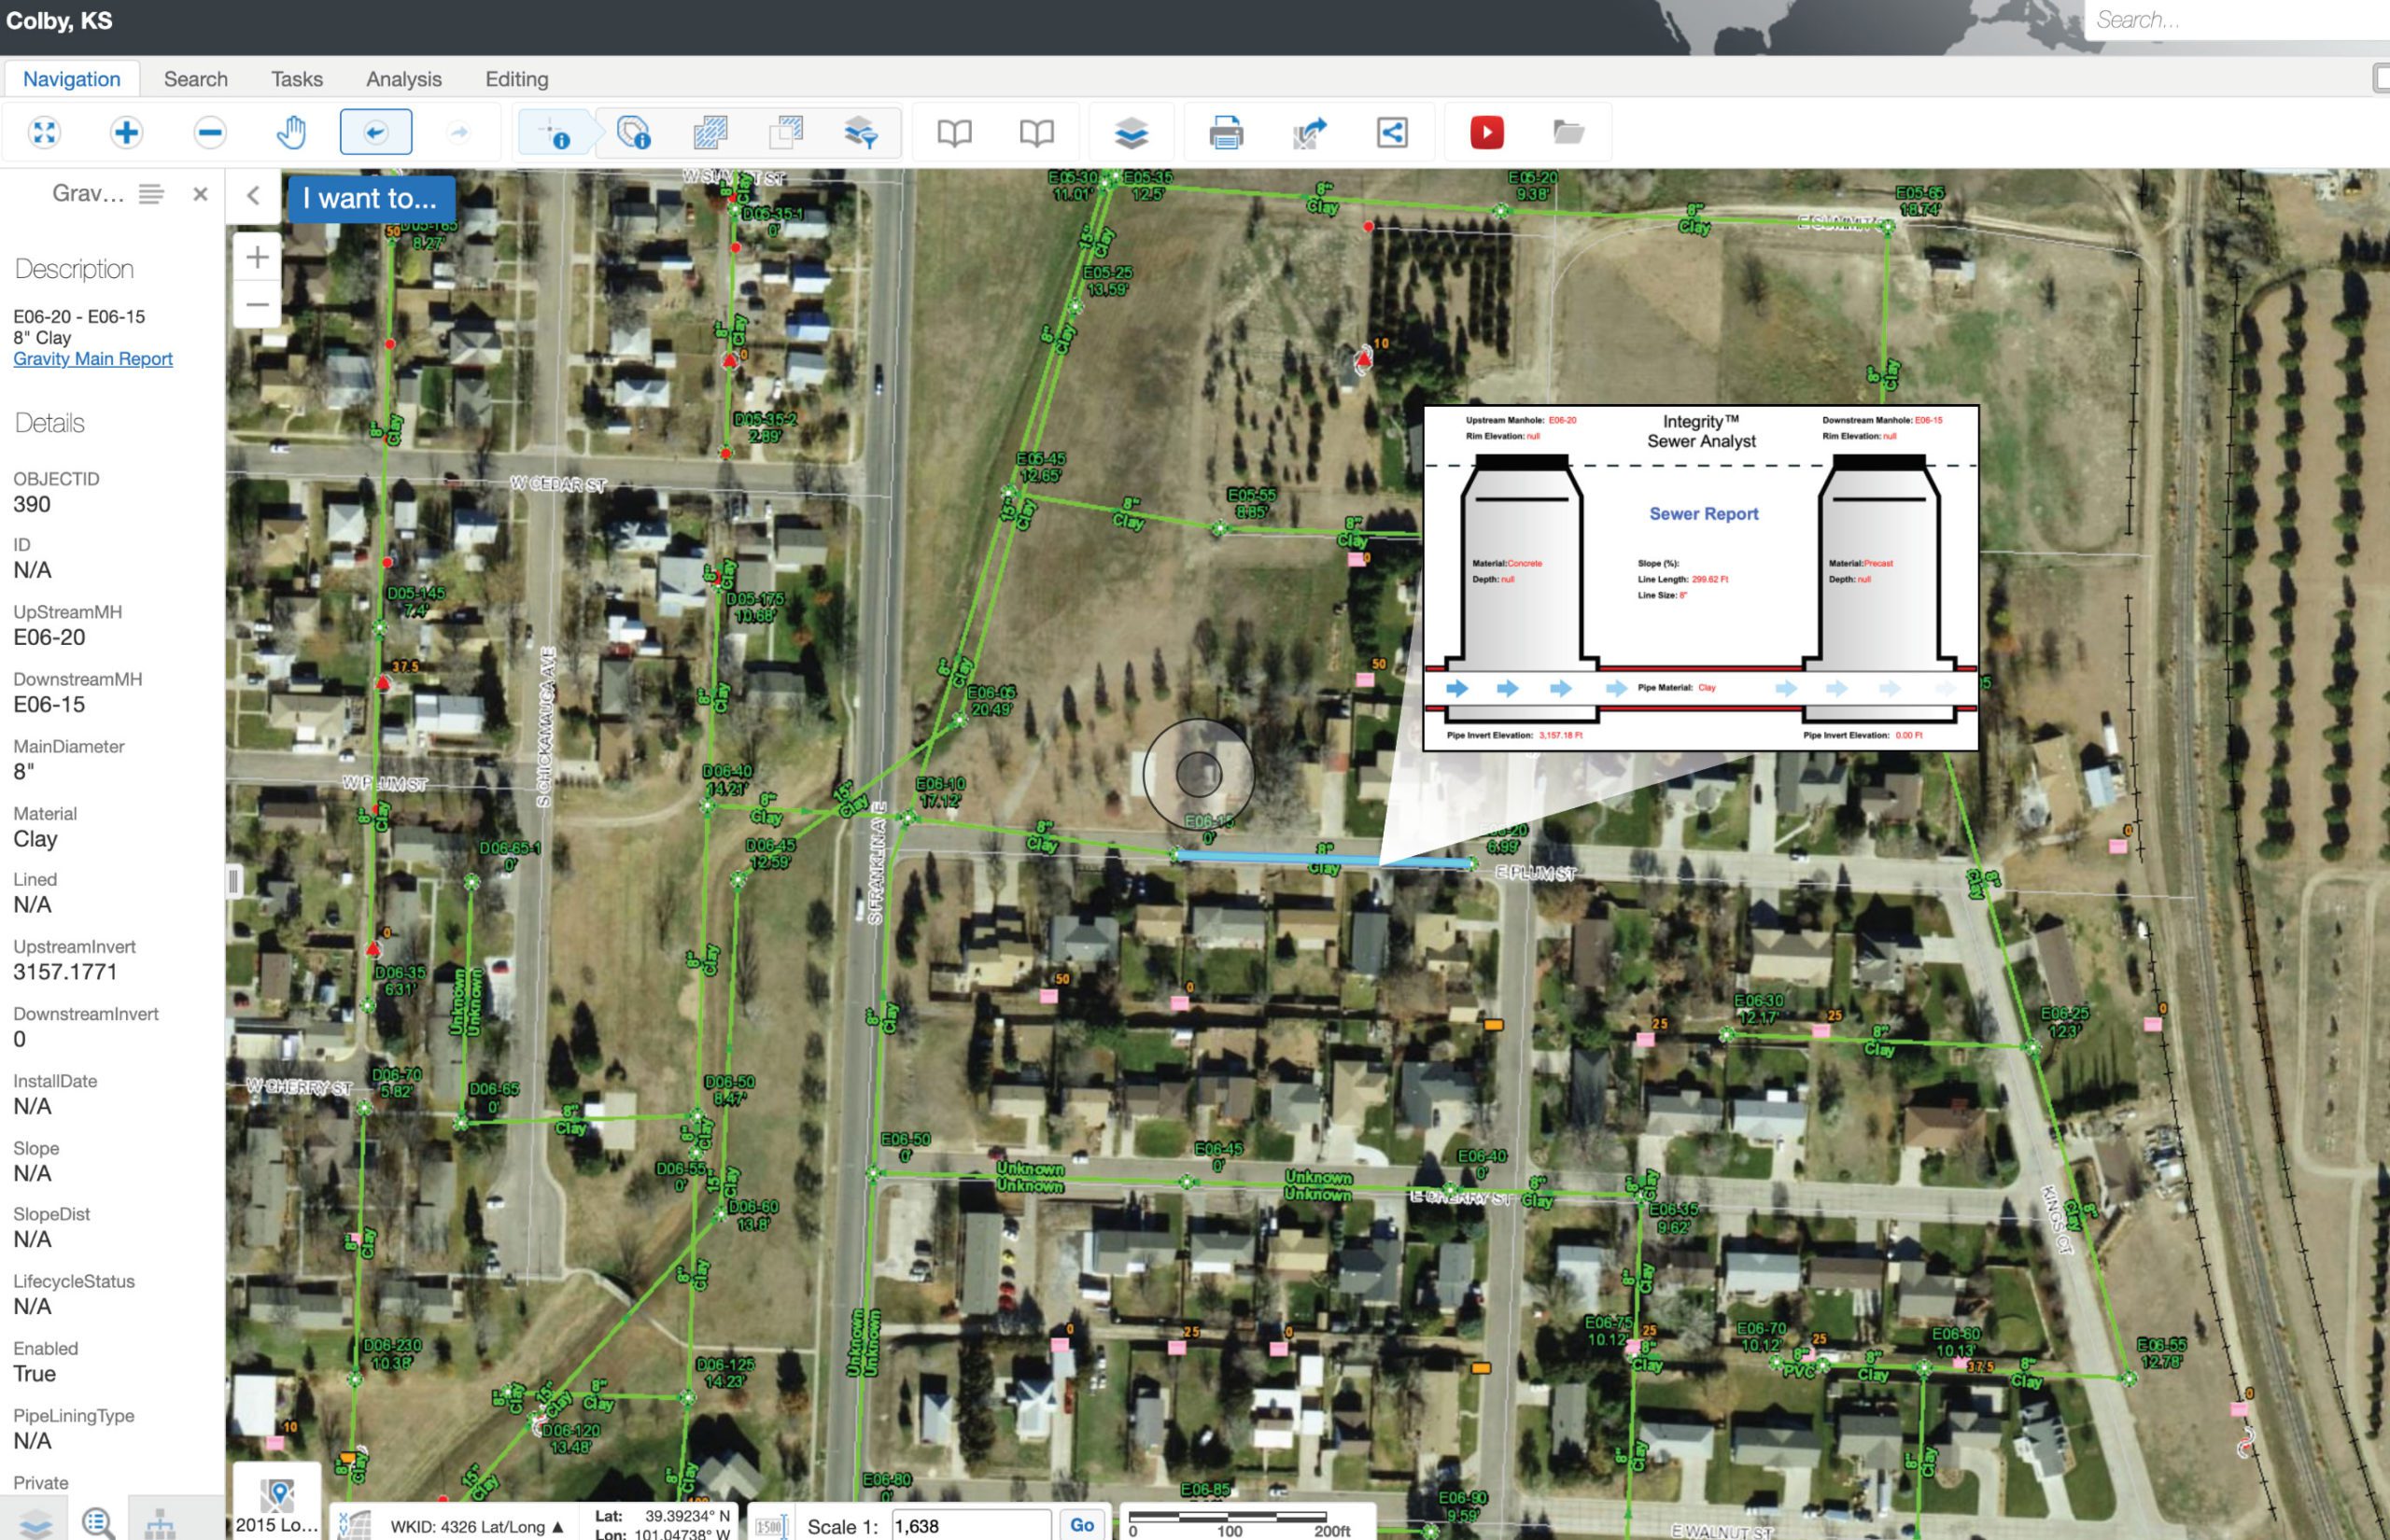
- Finally, and most important, was the creation of an all-encompassing geodatabase. This would be done in ArcGIS and allow the utility to search for combinations of defects based on geographic location. For example, if they needed to see all the broken conductors on concrete poles within five miles of a specific location, they would be able to, and have instant access to defect images.
The LiDAR and orthoimagery data acquisition was done using a combination of manned and unmanned aircraft. The Unmanned Aerial System (UAS) crews ran GPS base stations and weather stations, as well as operated the UAS to collect visual and thermal imagery.
Handheld GIS data collectors, with a customized data dictionary based on the client’s inspection requirements, were also used by the UAS crews while traversing the ROW. Gates, ROW obstacles, and visible structure defects were noted, photographed, and automatically placed into a geodatabase that updated in near real-time.
Data was sent back to the office for analysis and processing. The inspection team used a customized tool developed by SAM called SAM Inspect™ to analyze imagery for defects, catalog the imagery, and place it into the GIS database for final delivery. The SAM team reviewed more than 32,000 insulators and over 45,000 individual connection points including the static line. SAM also created a 3-D model of the conductor, in order to find all vegetation, buildings, and other items encroaching on the conductor.
Some statistics of what the field teams and office inspection teams accomplished over the eight months of the project include:
- 6,927 Structures inspected
- 1,475 gates located and inspected, along 1,105 linear miles
- 1,799 broken, missing, or damaged insulators
- 13 damaged Corona Rings
- 430 splices located along the conductors
- 380 chipped or cracked foundations
- 377 vegetation encroachments
- 166 fences blocking the ROW
- 54 structures out-of-plum
- 6 instances of foundation movement
- 5 bird nests
- 2 broken conductor strands
- 1,202 other defects such as split poles, rust on hardware, bent and broken structural components
- 0 injuries
- 0 damage to client infrastructure
One important key aspect of this effort is that each of the anomalies listed above is geolocated. That means the client wasn’t required to sift through thousands of images to determine precisely where to send crews and what to fix. This allows the utility to more efficiently undertake the task of maintaining critical infrastructure.
To find out more about how SAM capabilities such as UAS can help with your project needs, see our Geospatial Services page.